A wild model appears…
The BREAKOUT FINDER app (which went live a few weeks ago now, and is also available for Android devices) is an amazing resource for contextualizing the probability of success and understanding of what factors are important for evaluating wide reciever prospects.
But, I’ve got something the BREAKOUT FINDER doesn’t have yet… a model for predicting rookie running back’s probability of breaking out in the NFL. And it’s good.
Really good.
So until the app’s running back update comes along (Nate Liss, proprietor of all-things BREAKOUT FINDER, is locked deep in a cave somewhere grinding away, I’m sure of it) I think this model might just become the most useful resource for evaluating, ranking, and ultimately selecting running backs in your rookie drafts. While this isn’t the official BREAKOUT FINDER roll-out, there’s certainly enough belief in this particular framework and proposed hit-rate to at least bring it under the umbrella, share it, grow and improve it, and see where things go from there.
Model Background
Before we jump into the model, a quick caveat: I’m pretty new to predictive modeling and R. I’ve got a background in working with data, and I’ll demonstrate the model’s usability, accuracy, and correlation to NFL players to ease any worry you might have right now. The model might only be in the v1.0 stage, but it’s already smashing my expectations.
When I started to build these models – and yes, we’re working with a composite of multiple machine learning models – I had two primary questions I wanted to answer:
- Can we accurately classify if a player will “breakout” or not?
- Does the probability of a our classifcation correlate to NFL success?
Inherently, the two questions are linked:
If a player breakouts out, they are going to have success in the NFL. However, there’s some additional context needed. The model is trained to classify the probability of each player’s chance to break out… at any point in their career. The model is not trained to predict a player’s fantasy points. To evaluate the usefulness of a breakout rating for fantasy, we’ll look at the correlation between breakout rating and the average PPR points per game over the first three seasons of a player’s career (a common technique to evaluate rookie projection models).
Why use a composite of multiple models? The simplest answer is: In this case, it’s the best model. We see a significant increase in the accuracy of predicting a breakout and an increased correlation to NFL fantasy success in seasons 1-3 when we use a composite over a single machine learning model. I’ll explore this more in some upcoming “model talk” articles. I suspect that if we had enough data, the models would likely converge. However, we have limited data in the NFL. As an imperfect metaphor, we have two ways to improve our understanding of a dataset:
- Look at lots of data
- Look at the available data in many different ways.
For better or worse, my model attempts to do the second.
Understanding The Model
To understand the model, we’ll answer a few questions:
- What is the model’s goal?
- What information does the model use to make its predictions?
- What are the results of the model, and how reliable are the results?
The Goal
Our goal is to predict if a player will breakout or not, with a breakout defined as any running back who had 1 or more top-24 PPR seasons.
Breakout = 1 or more finishes as a top-24 running back (PPR scoring)
No Breakout = 0 season finishes as a top-24 running back (PPR scoring)
The model identifies which player profiles were more likely to break out and then makes a prediction for each player. Additionally, a player’s predicted probability of breaking out is computed, just like in the app.
Breakout Rating = A players probability of breaking out (1 or more top-24 PPR seasons during their career)
The Model Inputs
To train models, we’re looking for inputs that fulfill two qualities:
- Predictability: Are we selecting predictive metrics?
- Context: Are we capturing a complete profile?
These are the inputs I selected, broken into 5 categories:
Draft information: Draft age, draft round
College counting stats: All yards
College efficiency stats: Yards per touch, yards per team pass attempt
College offense share stats: MS rushing yards, MS rushing touchdowns, MS receiving yards, and MS receiving touchdowns
Player athleticism and size: Height-adjusted speed score, weight-adjusted speed score, forty-time, and weight
Who’s included?
The model is “trained” on drafted players from 2003-2017. Predictions are eventually made for every player, but players from the 2018+ draft classes weren’t included in the training sample because they haven’t had an equal chance to break out yet. Additionally, we’re also going to be using their fantasy points from their 1-3 seasons in the next phase of the analysis.
The Results
The accuracy of the model is about 85%. Which is good, but some additional context is needed. Classification models are evaluated differently than linear-regression models, so they don’t produce an R-squared (don’t worry, I’ll give you a sexy R-squared soon).
Looking at a few quick metrics gives us a good understanding of exactly adapt the model is at identifying breakout players.
Summarized Model Performance:
- The model correctly classifies if a player is a breakout or not 85% of the time (accuracy).
- The model correctly identified 69% of all possible breakouts (recall).
- Out of all the projected breakouts in the model, 88% were actual breakouts (precision).
That’s pretty impressive considering we only put players in two buckets: Breakout or No Breakout. The model becomes even more powerful when we look at the predicted probabilities of each player breaking out – their breakout rating.
Here are the breakout ratings for the 2020 class:
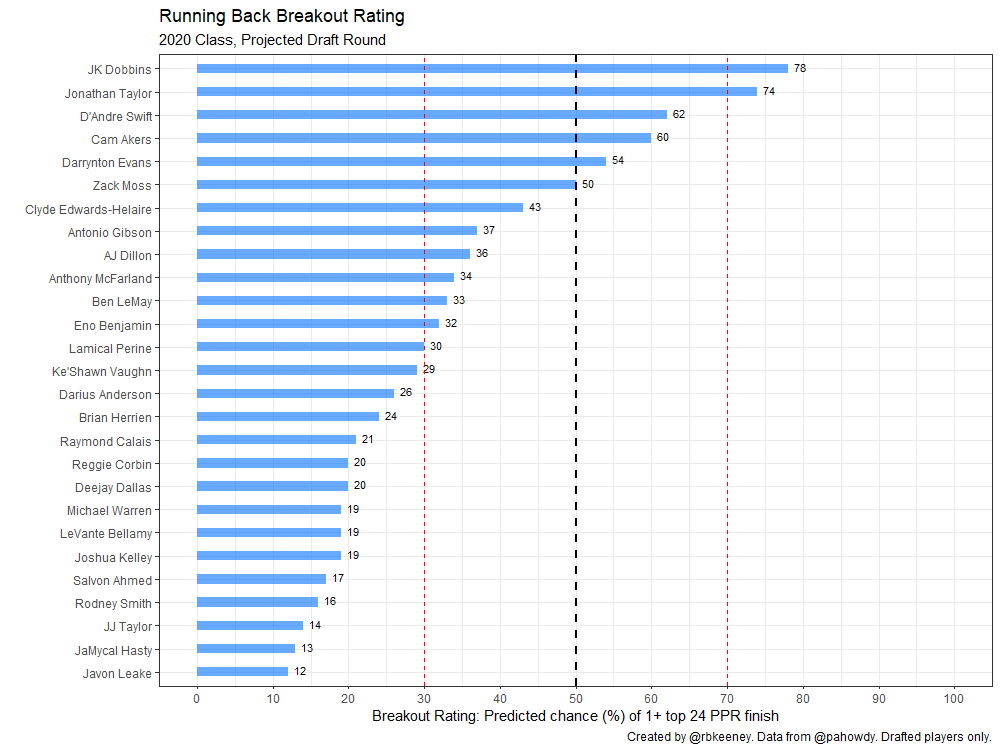
2020 Class at a Glance
The model predicts that J.K. Dobbins has the highest chance to break out in the NFL, followed closely by Jonathan Taylor, D’Andre Swift, and Cam Akers. That shouldn’t be a big surprise because they are typically viewed as top 5-6 players by analysts.
Darrynton Evans is rated at #5, a nice mini hot-take for the debut of the model (hey, it wants some attention too). Clyde Edwards-Helaire comes in with a disappointing rating of 43, which is oddly low for a projected 2nd round draft pick. Ke’Shawn Vaughn is a good prospect, but he’s expected to fall in the draft – tanking his breakout rating. Antonio Gibson’s score of 37, 1 more than A.J. Dillon, also raises some eyebrows.
Making better bets
The model is accurate, AND it’s being conservative. Trust the model when it says a player doesn’t have a high likelihood of breaking out: No players with a sub-20 breakout rating have a top-24 PPR season in my test sample (72 players… no breakouts).
We can also split the breakout rating into 4 groups, to generate some ranking tiers:
- Poor: Breakout Rating 0-29 (sub-50th percentile prospects, 5% hit rate)
- Okay: Breakout Rating 30-49 (projected misses with a chance, 37% hit rate)
- Good: Breakout Rating 50-69 (projected breakouts, 80% hit rate)
- Elite: Breakout Rating 70+ (90th percentile prospects, 97% hit rate)
Correlation to NFL Fantasy Success
We’ve shown that we can identify breakouts with some success. Now, it’s time to see if the breakout rating is also predictive of early career success.
Hint: Yup.
To measure that, we’ll look at the correlation between breakout rating and the average PPR points per game for the first 3 seasons of a player’s career.
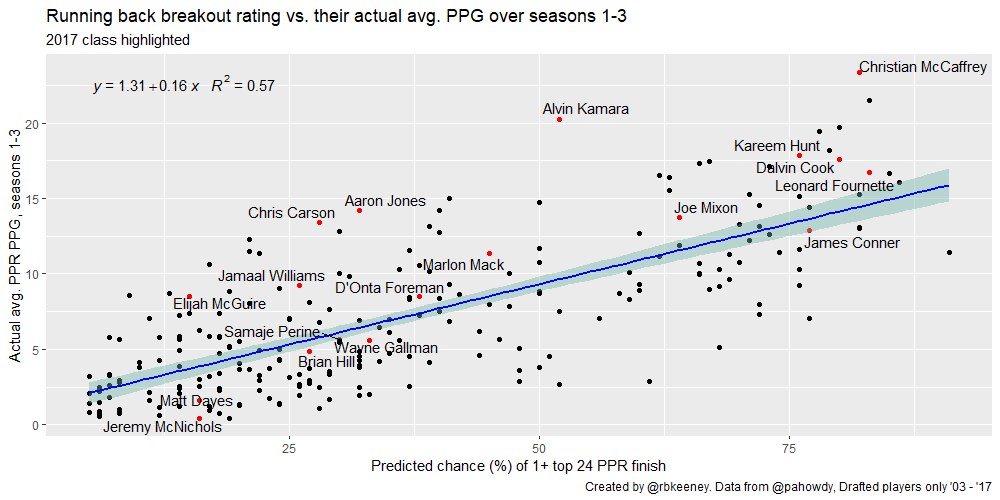
Yeah. That’s good. Realllyyy good. Throw your old model in the trash good. With this data, we can even start to predict a range of outcomes for individual prospects.
As an example, let’s take a closer look at Edwards-Helaire.
Edwards-Helaire has a breakout rating of 43. Using our breakout rating to NFL PPR PPG chart, we can estimate his expected point per game average to be around 8.2. Also, we can estimate his expected range of outcomes knowing that the standard deviation of the error is 3.3 PPR points per game:
- 68% chance to average between 4.9 and 11.5 PPR points per game.
- 95% chance to average between 1.6 and 14.8 PPR points per game.
Continuing with our example, one high-end comparison for Edwards-Helaire is Devonta Freeman. Freeman was drafted in the 4th round, while Edwards-Helaire is projected as a 2nd round pick, but both have similar breakout ratings, size, athleticism, and production profiles.
Freeman averaged an exceptional 14.98 PPR PPG in his first 3 seasons – well above what the model expected.
Just like Freeman, Edwards-Helaire can become a top-12 RB in dynasty, it’s just very unlikely. More importantly, that’s not even considering that his ceiling will always be limited compared to the top-4 running backs in this class based on his profile.
Comparing Breakout Ratings Between Players
Using this handy little chart, we predict how likely a player out-produces another player only using their breakout ratings.
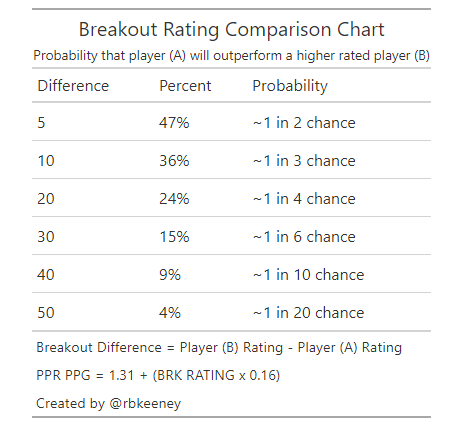
For example, Edwards-Helaire has a breakout rating of 43, 19 less than Swift‘s rating of 62. A quick glance at our chart tells us that Edwards-Hilaire has about 24%, or 1 in 4, chance to average more points per game during their first 3 seasons.
Using Breakout Rating to Improve Your Rankings
You knew this disclaimer was coming: My rankings are different than the breakout rankings.
Just… not that different. You should be open to adjusting players based on additional information like landing spot or their level of competition in college – two things the model doesn’t “know”.
Want to put Akers at RB1? The model thinks that’d be okay if he’s drafted in the 1st or 2nd round. It’s not what the model would do, but it thinks that could be a realistic outcome.
Do you have Eno Benjamin as the RB1? The model says,,, “lol, no.”
When evaluating a new rookie with their breakout rating, I like to go through 4 steps:
- What was their breakout rating?
- What are the players expected range of outcomes in the NFL?
- What is the probability that this player outproduces his peers?
- Is there additional information (injury history, NFL landing spot) that I haven’t considered?
Adjust when you think you know something the model doesn’t. For example, just look at Alexander Mattison. In 2019, he had a breakout rating of 62, good for #2 overall in the class. Your RB2 shouldn’t be the player who was drafted behind Dalvin Cook, no matter how compelling their profile is.
Dumb model. I’ll fix you up in v2.0.
What’s Next?
Over the next few weeks, I’m going to share more insights about the model and how it projects for players. Here’s a quick sample of what to look forward to:
- Evaluate and compare 2020 prospects (e.g. What happens if Jonathan Taylor falls to the 3rd round? 1st round? How does the 2020 class compare to 2017?)
- Model breakdown (e.g. How accurate are they individually? What metrics does it put a priority on?)
- Model strengths and weaknesses (e.g. Where can we add additional context?)
- Running back breakout rating Q & A
Thanks, I hope you find the running back breakout ratings useful. I’ve got a lot more analysis coming your way, and fast. Questions? You can find me on twitter at @rbkeeney.