In this post, I’m going to go through some common questions about the running back breakout model. Additionally, I’ll highlight some unique and not-so-obvious ways to use the breakout ratings.
If you have a question that isn’t answered here, you can contact me @rbkeeney on twitter.
Q: How should I use the running back breakout ratings?
The running back breakout model (and my additional research) are focused on providing the following:
- A tangible rating system on the probability that a rookie running back breaks out in the NFL
- Accurate, early-career fantasy projections
- A simple method for comparing player outcomes
Ultimately, my goal for the running back breakout model and the accompanying work is designed to help fantasy gamers in player selection and the ability to think more probabilistically.
(You can read more about my model here.)
Q: What is a breakout rating?
A running back’s breakout rating indicates the player’s predicted chance of having at least one top 24 PPR season. In other words, if a player has a rating of 50, they have a 50% chance of breaking out. Importantly, the model leans a little to the conservative side because it puts a priority on getting the breakouts right, which means the extremes (very low probability, or very high probability) are not rated quite as aggressively as they could be.
Q: What is a good breakout rating?
Obviously, the higher a breakout rating is, the better. Any player who has a rating above 50 is projected to break out, while a breakout rating of 70+ is in the 90th percentile of all prospects since 2003.
| Running Back Breakout Model Categories | |||||
|---|---|---|---|---|---|
| Breakout Rating: Probability of 1+ top-24 PPR season | |||||
| Prospect Category | Projected Miss | Projected Hit | All | ||
| Poor | Okay | Good | Elite | ||
| Breakout Rating | 0-29 | 30-49 | 50-69 | 70-100 | – |
| Percentile | 0-50 | 50-75 | 75-90 | 90+ | – |
| Actual Breakout Rate | 5% | 35% | 80% | 97% | 37% |
| Sample Size | 111 | 54 | 35 | 32 | 232 |
| Created by @rbkeeney | |||||
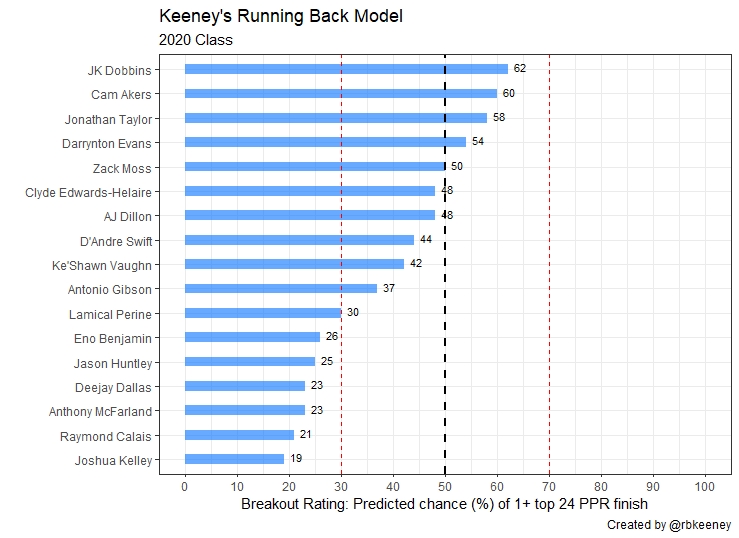
Q: How does the 2020 Class look?
Here are the final ratings for the 2020 running back class.
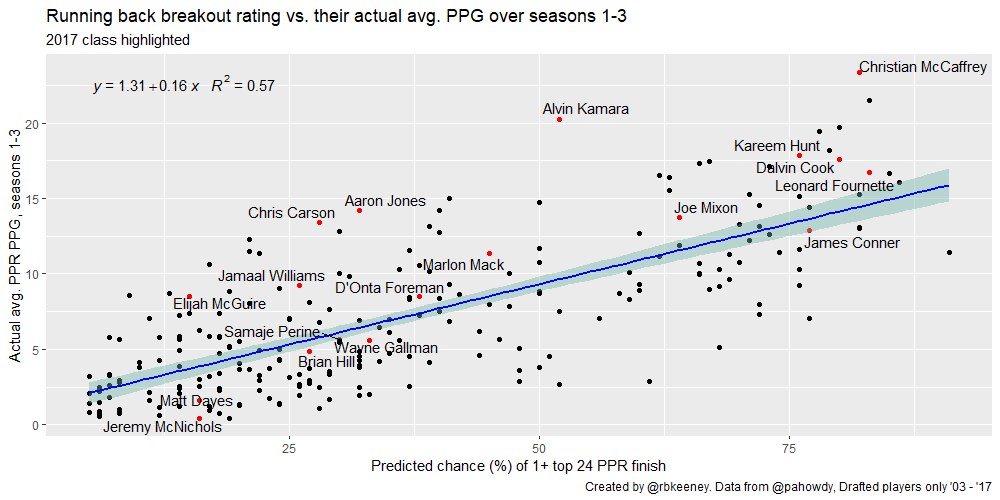
Q: How well does the breakout rating correlate to fantasy success?
It’s close. Draft round alone has an R-squared of 0.29, while breakout rating has an R-squared of 0.57.
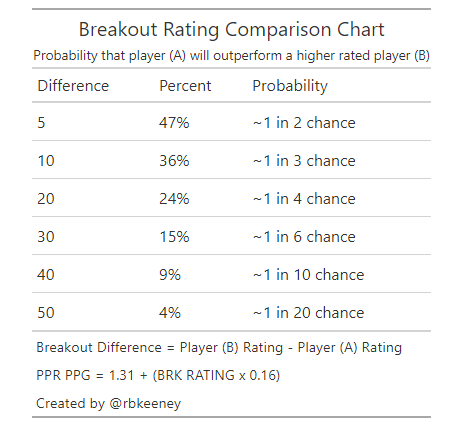
Q: How can I compare prospects?
The easiest way to compare prospects is to look at the Breakout Rating Comparison Chart. For example, Clyde Edwards-Hilaire has a breakout rating of 48. That’s 10 percentage points lower than Jonathan Taylor‘s rating of 58. A quick glance at our chart tells us that Edwards-Hilaire has about a 36% chance to average more points-per-game during his first three seasons.
Q: How can I compare breakout ratings to current NFL players?
There are two primary methods to do this. The first is to compare their prospect profiles using their breakout score. (For example, Taylor has about a 1-in-4 chance to outperform Saquon Barkley in the NFL, based on each player’s college profile.)
However, we know Barkley is an exceptional NFL player, so we should update our probability. That leads to my second method, estimating the probability that a player outscores an NFL player based on average PPR points per game.
To do that, I use the standard deviation of the error (or standard error, SE) in our correlation of breakout rating to points per game: 3.3 PPR points-per-game:
- 68% confidence that the PPR points per game fall within +/- 1x SE (+/- 3.3 PPR points-per-game)
- 95% confidence that the PPR points per game fall within +/- 2x SE (+/- 6.6 PPR points-per-game)
Back to Taylor. He’s expected to score 10.6 PPR points-per-game based on my current projection. Next, I add 2x the standard error to get the upper bound of his 95% confidence level: 17.2 PPR points-per-game. Finally, since we’re only looking at the probability that Taylor exceeds the 95% confidence interval, we must divide his chances in half to arrive at our prediction that he has less than a 2.5% chance to exceed 17.2 PPR points-per-game in the NFL.
Ultimately, the model gives Taylor less than a 1-in-40 chance to outproduce Barkley’s historic 21.5 PPR point per game pace in the NFL — a much more realistic prediction. That’s not because Taylor is a bad prospect; Barkley has just been, as they say, generational.
Q: What inputs have the most importance?
The different models each put a different priority on different metrics, and the composite of the models is much more accurate than a single model. Roughly, the composite model categorizes things in the following order:
- Tier 1: Draft round
- Tier 2: Speed scores, adjusted efficiency metrics like yards per team attempt, MS rushing stats, age-adjusted production statistics
- Tier 3: MS receiving stats, draft age, weight
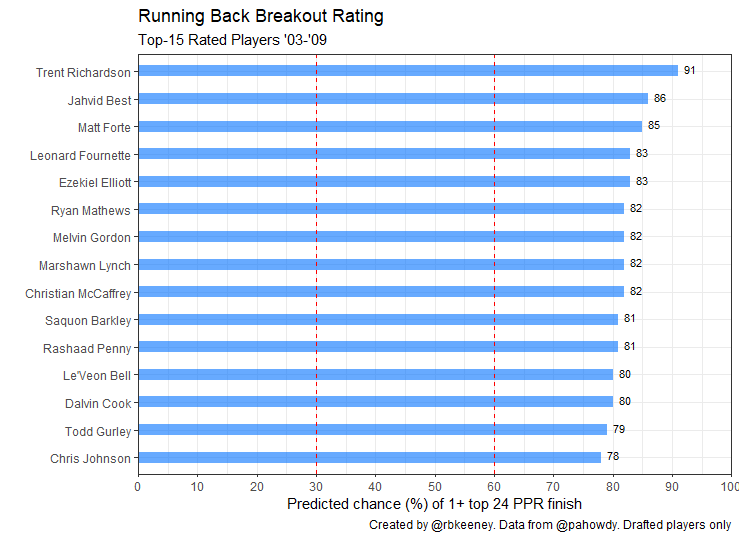
Q: Which running back has the highest breakout rating of all time?
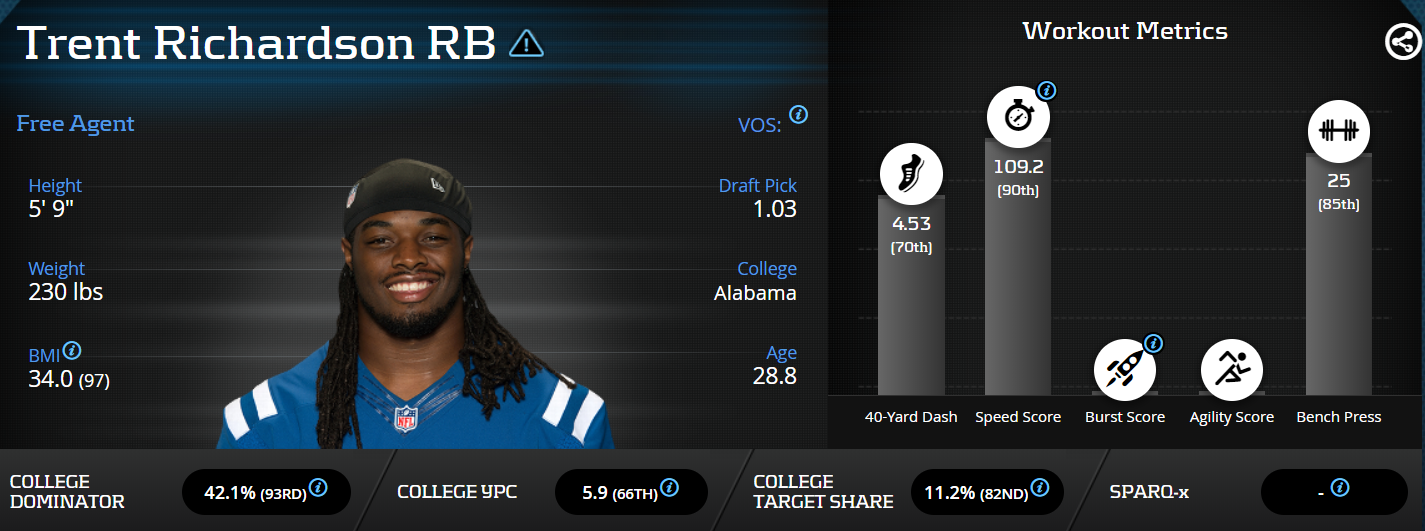
Trent Richardson was drafted by the Browns with the third overall pick in 2012. He had a 90th percentile speed score, 93rd percentile college dominator, 97th percentile BMI, and an 82nd percentile target share, giving him the highest breakout rating ever at 91.
After his flameout in the NFL, it’s easy to forget Richardson had a top-12 season in the NFL and was a dynamic and dominant college player, returning 28 kick returns during his time at Alabama at 230 pounds.
Proving that the model is not biased to one body type, Jahvid Best comes in at number 2 overall, with a breakout score of 86.
Entering the league as a late first round pick after a scary injury at Cal, Best was undersized at 199 pounds, but ran a mind-blowing 4.34 forty and 6.75-second 3-cone. Sadly, due to injuries, he only played 22 games for the Lions while averaging 11.5 PPR points per game, 3.6 less than expected.
All things considered, the only black-eye in the top 15 is Rashaad Penny. Every other player in the top-15 has recorded at least one top 24 season. Penny is still young enough to join the club, provided he recovers well from his season-ending knee injury.
Q: How does the 2020 class compare to prior classes?
The 2020 running back class looks like a slightly above average one (here’s my pre-draft class comparison). There isn’t a prospect in the 2020 class that quite reaches the stratosphere of all-time prospects like Barkley, Christian McCaffery, or Ezekiel Elliot. But that might be because the overall strength and depth of the 2020 draft class pushed running backs down teams’ boards.
While the 2020 class might not have the punching power of the 2017 class, it’s likely one of the deeper classes we’ve seen in the last five years, and easily better than 2019. All things considered, I’m very excited about the top 5-6 prospects.
Q: Does the model overrate players from non-power 5 conferences?
It doesn’t seem so. Non-Power 5 running backs average 0.33 less PPR points per game vs. their expectation when compared to Power 5 running backs. This small difference (0.33 PPR points per game) is equivalent to a breakout rating difference of 2. That’s well within the noise of the data, and discounting non-power players is likely just confirmation bias. For additional context, I put together a twitter thread that walks through the comparison.
https://platform.twitter.com/widgets.jsEvaluating how much we should weigh a rookie RB's strength-of-competition is tough.
— Ryan Keeney (@rbkeeney) April 9, 2020
It's easy to look at recent prospects like Penny, Henderson, Mattison and assume that we should be fading players from non-power 5 conferences.
Is that supported by the data? Let's look.
1/
Q: What might the model be overlooking?
There are a few things the model doesn’t know like which team drafts a player or who’s already on their NFL roster. Most importantly, NFL running back production is dependent on volume, offensive line, and how efficient the offense is as a whole. In other words, we should adjust our rankings if the landing spot is particularly good or bad.
Additionally, the model doesn’t know which college situations were the best, so it could be overrating players with highly-effective offensive lines. I believe that it’s still more likely that it doesn’t overrate these players because the model uses a lot of inputs that are offensive-neutral, like the share of rushing yards. For example, I didn’t really find any signal evaluating Power 5 vs. non-Power 5 players in my expected outcomes.
Finally, there are two areas that I think we should study more before drawing a conclusion: (1) Running backs who played behind elite backs in college (like Miles Sanders), and (2) Players who elected to stay in school for their senior seasons. The market share numbers used in the model are all best-season numbers, so I suspect these effects should be largely captured by the model already.
Recently, I put together a twitter thread reviewing Edwards-Helaire that hits the impact of burst scores, draft age, speed score, receiving stats, and much more.
https://platform.twitter.com/widgets.jsReady for the ultimate breakout down of Clyde Edwards-Helaire? Spoiler alert: I'm going to be lower on him than consensus.
— Ryan Keeney (@rbkeeney) April 26, 2020
Behold… A thread of threads (!)
I'm so sorry. pic.twitter.com/QRIJQERWTj
Q: Travis Etienne, Chuba Hubbard, Najee Harris all elected to stay in school instead of coming out early. Where would they have ranked in the 2020 class?
The model thought Travis Etienne and Chuba Hubbard were excellent prospects, ranking them just behind J.K. Dobbins and Taylor and ahead of D’Andre Swift and Cam Akers. Here’s where they would have ranked using the pre-draft projections:
| Player | Projected draft round | Breakout Rating (# in 2020 class) |
| Travis Etienne | 1st | 72 (1st overall) |
| Chuba Hubbard | late 1st – early 2nd | 68 to high 50s |
| Najee Harris | 2nd | 40 |
Q: How important is draft capital is the model?
Draft capital is by far the most valuable single piece of information we can know about a prospect. In fact, it’s the only stat that is ranked the same spot (#1) in importance by all the models. However, the rest of the information in the model combined is more predictive than draft capital by itself.
To evaluate the importance of draft capital for the model, I could train a new model without draft capital, but that wouldn’t teach us anything about the breakout model. Instead, I can evaluate how accurate the model is without draft capital by neutralizing it. For example, I could neutralize draft value within the model by assigning an average value to all drafted players, like the third round, and then evaluating the results.
If we assume every player drafted since 2003 was drafted in the third round, the model still pulls down a strong R-squared value of 0.45, an excellent number for a model that cannot use draft capital to differentiate its projections.
| Breakout Rate By Draft Round | |
|---|---|
| Breakout Rating: Probability of 1+ top-24 PPR season | |
| Draft Round | Actual Breakout Rate |
| 1 | 87% |
| 2 | 55% |
| 3 | 48% |
| 4 | 21% |
| 5 | 19% |
| 6 | 18% |
| 7 | 15% |
| Created by @rbkeeney | |
Q: What are the differences between the model, pre- and post-draft?
The way the model predicts breakouts does not change. However, before the draft, I used projected draft capital to estimate breakout ratings. Then, after the draft, I updated the model with the correct draft capital and locked in the results.
I prefer this method for two primary reasons. First, since the model is the same, I’m working from a unified method of projections vs. competing models. Second, pre-draft grades add context that I cannot. For example, I add zero value through film analysis, and draft grades help me take the opinion of NFL scouts into account. And finally, I can always adjust a player’s projected draft capital to get an idea of what his breakout rating ranges are likely to be.
Q: Is the model overfit?
The short answer? Not likely.
To address this valid concern, I’ll go through three different areas and discuss how I tried to mitigate overfitting.
Sample size
The first, and most common issue in working with the NFL is working with a small set data. On average, about 16 – 17 running backs are drafted in the NFL every year. That means we need a lot of drafts to get up to a respectable sample. Luckily, Peter Howard has a database that has running back stats and outcomes going back to 2003. Since we need to give running backs three years in the NFL to break out, that gives us a sample of over 230 players.
Problem set-up
The second issue that can arise when building a model is asking it to predict too many different outcomes relative to the sample size. With that in mind, I selected to solve a binary classification problem (i.e., will the player break out or not?) vs. trying to project fantasy points per game.
Once the classification problem was set-up, I had each model report what probability they projected of each player becoming a breakout. That number becomes the breakout rating.
Most importantly, the correlation of breakout rating to fantasy points-per-game was completed independently of the classification problem, as an exercise to try and quantify the usefulness and error of the breakout ratings.
Training and testing the model
Finally, there are two common techniques that can be used to evaluate machine learning algorithms and limit overfitting.
First, I can use a resampling technique to estimate model accuracy. I chose to use 10-fold cross-validation for each individual model.
Second, I can hold back a validation dataset. I set aside 20% of the samples to validate the results and trained the model on the remaining 80%.
Q: What might change for version 2.0?
The running back breakout model is still in its infancy, a version 1.0 if you will. Consequently, there have been a few things that I’ve learned during the development phase along with suggestions from others that could make their way into version 2.0.
Digging into the model and trying to identify if there are any consistent errors in its projections is my first priority. Some ideas to investigate include:
- Running backs who transferred later in their college career, like Joshua Kelley.
- Running backs who played behind, or with, elite prospects during college (Miles Sanders, Derrius Guice).
In version 2.0, I’d like to replace or remove some of the more highly-correlated numbers within the model. For example, the height-adjusted speed score might be replaced with a burst score. Or, we could add an agility score, teammate score, special team score, landing spot opportunity score, and some additional college context statistics. Most of those stats were considered at the onset of the project (especially some of the agility and burst scores); however, I opted to exclude them because relying on multiple combine drills would force us to drop a significant portion of our dataset. Forty-yard dash time remains in the model because most players run it at the combine, and it is required to calculate speed scores. Also, I can estimate players’ expected 40-time range reasonably well based on scouting reports.
I would also like to expand the predictions to undrafted free agents. (Who doesn’t want to be the first to find the next Austin Ekeler?)
And last of all, well… I’m taking suggestions.
Anything else?
Do you have a question that wasn’t listed here? Let me know @rbkeeney.