They Ain’t Like the Rest
The more I study running back prospects, the more I come to the conclusion that being “just good enough” doesn’t cut it. The best running backs in the NFL typically have at least one, and usually more, metrics in their college profiles where they were outliers.
As a result, I’m more interested in a player with a sharp profile (excels in 1-2 metrics, average at the rest) vs. a player with a flat profile that’s above-average across the board.
Put another way, If a player isn’t special – they are replaceable.
In search of outliers
Anecdotally, the JAG argument holds up. Even if they are a highly-productive in the NFL, players drafted in rounds 4+ seem to get replaced at an alarmingly high rate (sidebar: What are you doing Green Bay? Aaron Jones is GOOD). JAGs require the right mixture of a high-powered offense and lack of competition to vault themselves into the upper-echelon of fantasy football running backs, and if either of those conditions changes… they fall. Fast.
So, how can we identify who’s just-a-guy and who’s an outlier?
Let’s look at three ways to spot outliers: correlations, thresholds, and a model:
Correlations
As I look for outliers, the first metrics I look at are stats that most strongly correlate to fantasy success; for example, draft round, speed-scores, and age-adjusted production metrics. That last one is a little better for wide-receivers, but you get my point: If there is a signal… we need to pay attention.
Thresholds
Next, I can expand our view to metrics that are aren’t correlated to fantasy success, such as yards-per-touch (YPT). In fact, the number of games played by a college running back has a higher correlation coefficient to fantasy points scored than YPT!
In these cases, we need to shift our focus to thresholds. Specifically, do outliers in YPT matter? Yup.
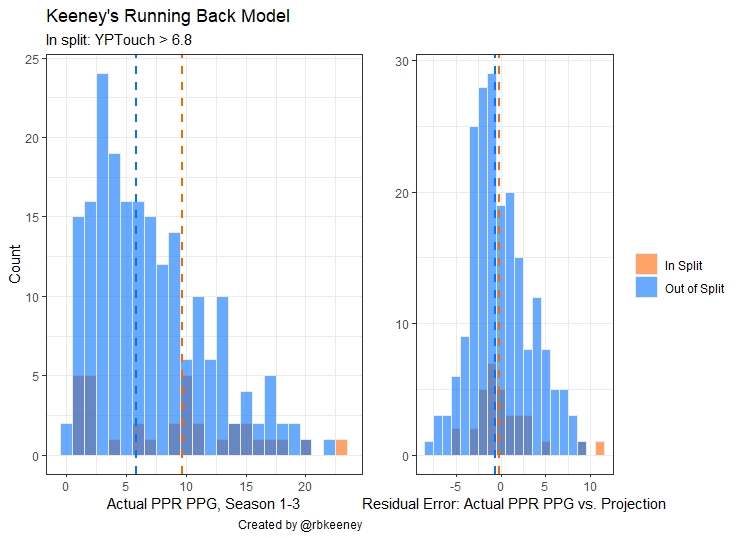
Players with a YPT greater than 6.8 significantly outperformed their peers (and I didn’t even control for a touch minimum)! Which players from the 2020 class exceeded this threshold? Jonathan Taylor, D’Andre Swift, Anthony McFarland, Raymond Calais, and Javon Leake.
Does that mean players like JK Dobbins or CEH won’t be as successful right? No!
This is the biggest danger of using thresholds for analysis. The performance of the outliers is useful for describing only the outliers – it is not useful for comparing players, especially if a player is just on the other side of the arbitrary threshold we set. Consider if I had bumped the threshold down to 6.4 YPT, Dobbins would now be in our split and look like an outlier.
In summary, use thresholds to identify outliers (positive or negative), and remember: Using thresholds like this to it to say players under (or over) the threshold (e.g. not outliers) are going to be bad just isn’t good process.
modelS
You might be thinking: Wow, I wish there was a way we could combine our correlations and thresholds and into some form of meta-analysis’. And yeah, I had the same question, so I built a breakout model. Among a few things, it looks at thresholds (via random forest), and highly correlated stats (via linear regression). For more info on the model, check out the intro, class comparison, and a Q & A.
Here’s how the model sees the running back class of 2020:
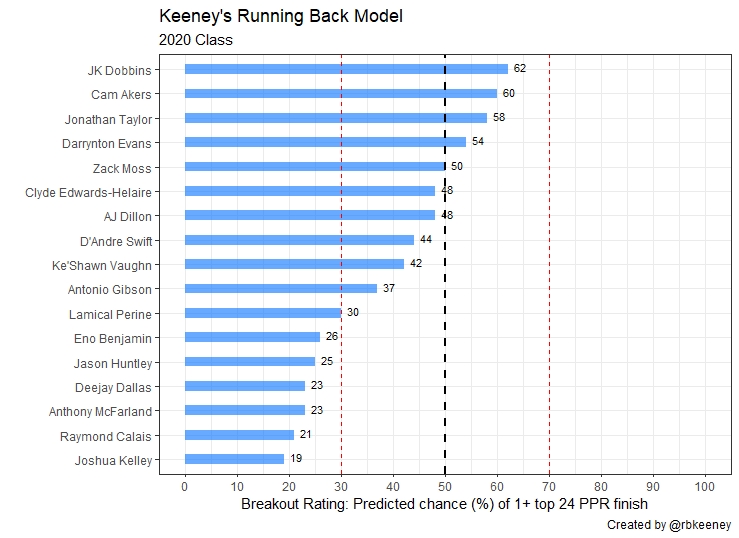
Ratings that fall between 40-50 are somewhat of an unofficial “JAG” range. That’s not to say these players can’t become top-12 dynasty assets (see: Devonta Freeman) or fantasy contributors like Marlon Mack and Devin Singletary. It’s just chock-full of players who contributed 1-2 seasons of fantasy success and then were unceremoniously replaced; or, high profile prospects who underwhelmed at the next level (Bishop Sankey, Ronnie Hillman, Justice Hill).
If you want the best. You want outliers.
The curious case of Clyde Edwards-Helaire
And that’s why I’m having such a hard time buying into the Clyde Edwards-Helaire hype.
Yes, his landing spot is an absolute dream. Yes, Burrow loves him. Yes, Mahomes and Reid love him. Yes, many, many, many, analysts love him.
But, he’s not my 1.01 (or my 1.02).
In fact, I think there’s a case to be made he could be the 1.04 or 1.05 behind either Cam Akers or DeAndre Swift. Simply put, his profile is a mixture of pretty-good production and efficiency metrics, sub-par (but excusable) athleticism… and a concerning lack of any area that shouts OUTLIER.
Show me something special
Let’s break down Clyde Edwards-Helaire’s college profile.
Athletism & Size: First off: I’m not a size-truther. I have zero, ZERO, concerns with Clyde’s compact 209 lb frame. Does his 36th percentile speed score concern me? Yes. Do I care about his burst score? Not really. And… that’s about it. I’m not really concerned that CEH is a thicc Spud Webb – I’m more focused on production.
Production: The model primarily relies on a player’s BEST season – kind of a “your as good once as you’ve ever been” type of model. Yet, it also cares about your overall body of work (total scrimmage yards has one of the strongest correlations to fantasy success). So, CEH’s lack of production prior to 2019 (below 50th percentile in total scrimmage yards) is concerning. I mean, Nick Brossete wasn’t exactly good and lead the team in touches in 2018.
Furthermore, none of the best-season production metrics indicate Clyde Edwards-Helaire is an outlier. Let’s run through the list:
- Best yards yard per touch (67th percentile)
- Best yards per team pass attempt (53rd percentile)
- Best MS rushing yards (65 percentile)
- Best MS rushing touchdowns (65th percentile)
- Best MS receiving yards (53rd percentile)
- Best MS receiving touchdowns (75th percentile)
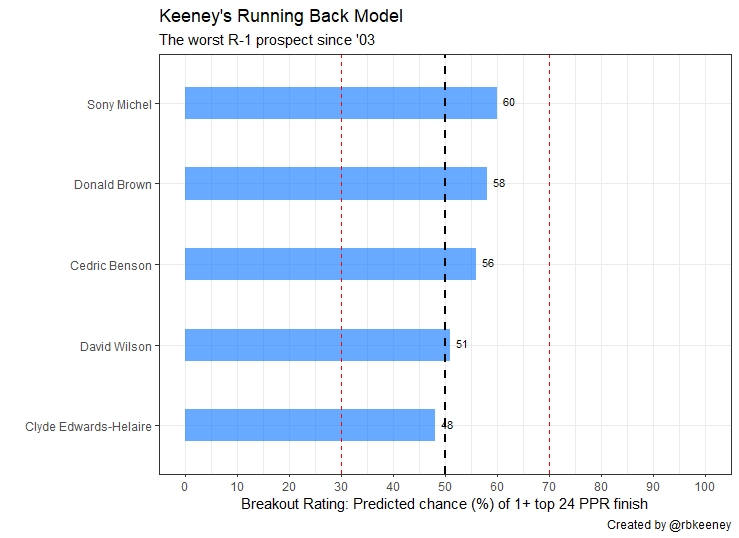
I mean, come on Clyde. I’m a FAN. I want to see something unique. Something special. And I did NOT mean something special like taking home the honors for the worst 1st round prospect since 2003.
Yikes.
Running backs (that catch) matter
Okay. You got me. I’m limiting my argument to MS metrics. There’s hope for other metrics like yards per route run. Per Graham Barfield, Clyde Edwards-Helaire had 1.5 yards per route run (which was 3rd best in this class) and that’s very close to CMC’s final year (1.6). But please, pay no attention to CMC also pulling in a ridiculous 22% of Stanford’s receiving yards.
How about Clyde’s amazing 55 receptions? Meh. Again, it’s very difficult to see CEH as an outlier in the context of LSU’s historically good offense.
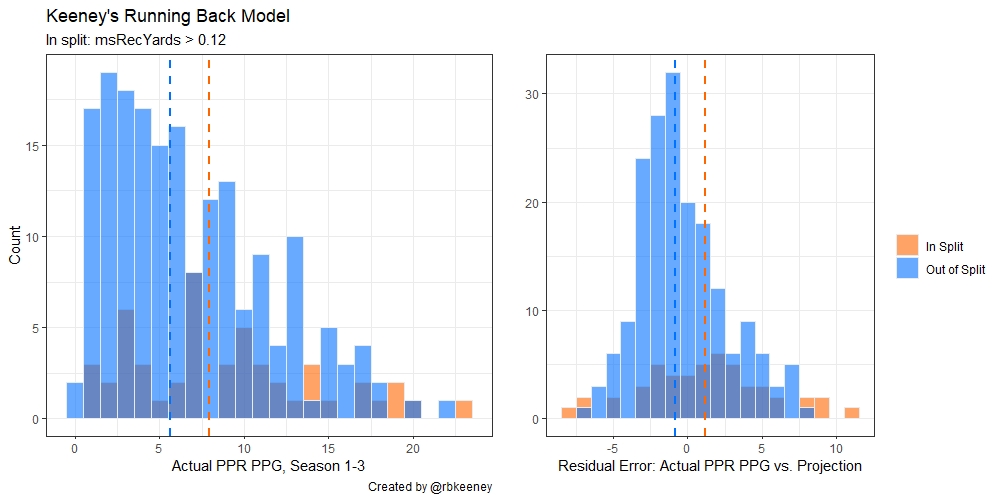
It’s also important to know the model is correctly adjusting for Clydes 7.2% MS of receiving yards. There is almost no difference in error between the model’s projection and actual fantasy success above or below that spit.
But, what about some real MS receiving yards outliers? Like Kamara levels and beyond?!
Whew.
Finally, we’ve found an area in the model where we can confidently adjust players upwards in our ranks: MS receiving yard outliers.
For context, in 2017 Christian McCaffrey, Leonard Fournette, Dalvin Cook, Joe Mixon, and Alvin Kamara all had MS rec yards greater than 12% …and CMC was at 22% (!!!).
In 2020, among backs drafted on days 1 and 2, Antonio Gibson, Zack Moss, Ke’Shawn Vaughn all had at least 1 year of 12%+ share of their team’s reception yards. Clyde Edwards-Helaire had a lower receiving yards share than Jonathan Taylor.
For more context check out Graham Barfield’s work on routes run:
Wisconsin really tried to get the ball to Jonathan Taylor as a receiver last year. Here are the top-12 RBs in targets per route run among the college backs I have charted: pic.twitter.com/D1hCr6j9Qg
— Graham Barfield (@GrahamBarfield) May 1, 2020
The infallibility trap
Andy Reid’s system is famously known for the successful running backs. Was their success improbable? No! The model rated every other major running back Reid drafted as excellent prospects.
- Jamaal Charles, 3rd round, rating: 60
- LeSean McCoy, 2nd round, rating: 67
- Kareem Hunt, 2nd round, rating: 76
Wait! What about a player CEH is commonly compared too: Brian Westbrook?
While he’s not in my database, Westbrook is literally the definition of a production outlier. While playing for the Villanova Wildcats from 1997 to 2001, he set an all-time NCAA record with 9,512 all-purpose yards. In 46 career games, he scored 84 touchdowns, had 4,298 rushing yards (6.2 avg.), and caught 219 passes for 2,582 yards (11.79 avg.). All said and done, he set 41 Villanova, 13 Conference, and 5 NCAA records.
No team, no GM, no coach is infallible. I’m not saying the Chiefs don’t know what they’re doing – I’m merely pointing out that CEH doesn’t compare very favorably to the ultra-productive players Reid has selected in the past when you look at the metrics in the model.
So, who are you going to trust?
For me, it essentially comes down to three key questions:
- Can we excuse Clyde Edwards-Helaire production prior to ’19?
- Can we properly contextualize his performance in the historic LSU offense?
- Can we trust the Chiefs?
As much I love CEH and I trust Andy Reid – I trust my process more, and the metrics I look at say he’s not an outlier.
What about the film?
I get it. Clyde’s film is intoxicating, and his spin move is absolutely filthy. I’m not going to fault you if you take Clyde Edwards-Helaire at 1.01 in your rookie draft. Certainly, your decision will be supported by some of the best film analysis in the industry (See @RayGQue’s breakdown of JT and CEH below).
Clyde Edwards-Helaire vs. Jonathan Taylor | Fantasy Faceoff: Rookie RBs | 2020 Fantasy Footballhttps://t.co/7CAmTvCZv5
— Ray G 🏁 (@RayGQue) May 1, 2020
It’s about the risk
Ultimately, I’m okay being wrong about CEH because I’m more comfortable when my top-rated player has rave film reviews AND has an outlier production profile AND an outlier athleticism profile. Simply put, my model says players like CEH are riskier bets than players like Taylor, Dobbins, or Akers. As a result, I have CEH slotted in at number 3 in my ranks, behind Taylor and Dobbins.
Agree or disagree? Let me know. You can find me @rbkeeney on Twitter.