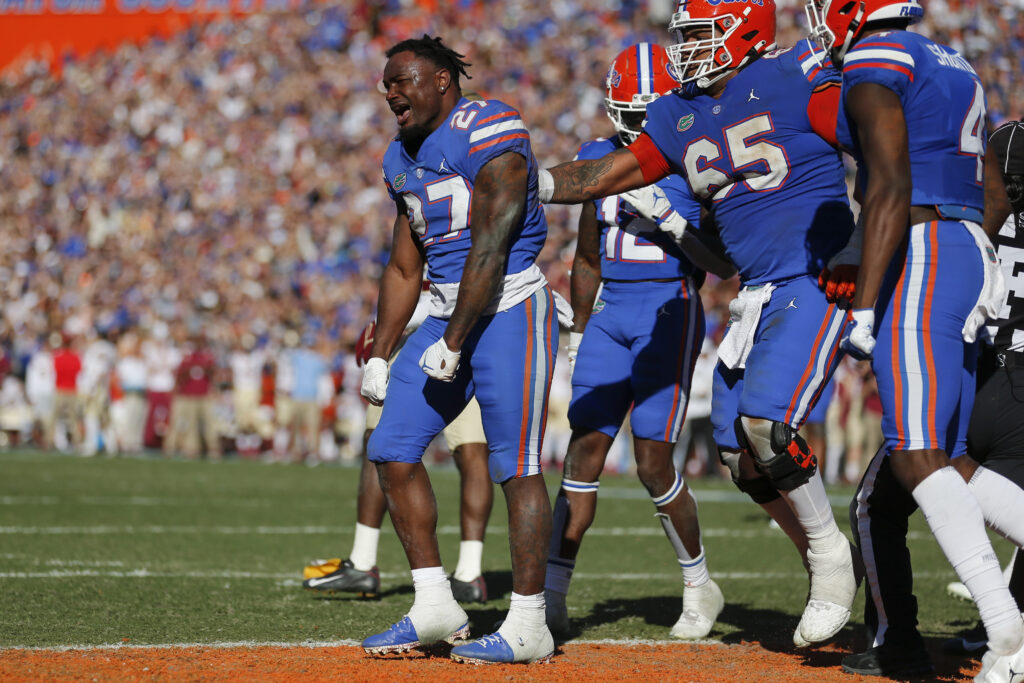
This article is part of a series in which I evaluate 2022 rookie running backs solely on their ability to run the ball. The first installments can be found here. If you happened to already catch those and don’t need a refresher on my methodology, feel free to skip to the player-focused analysis below the picture of Florida’s Dameon Pierce a couple paragraphs down.

Outside the ability of whoever happens to be running the ball, there is a whole mess of variables that factor into the effectiveness of a given rushing attack: scheme, play-calling tendencies, opponent strength and scheme, weather, offensive line play, surrounding skill-position talent, etc. And given this entanglement, separating the contributions of the ball carrier from the offensive environment in which he operates is not a straightforward task. My approach to doing that is centered around measuring the degree to which a running back is over- or under-performing the per-carry output of the other running backs on his team.
Starting from the premise that good runners do more with what they are given than do bad runners, it stands to reason that, provided players are operating under generally the same conditions (like, for example, playing on the same team), better backs should produce more per carry than lesser backs. Using this logic, we can establish a baseline for comparing efficiency between players on the same team; for each running back, we can compare his performance (X) to the collective performance of every other running back on the team (Y). If X > Y (essentially, if dude is doing more with his carries than his teammates are with theirs), we can probably conclude that the player in question is a good player, at least to some relative degree.
Assuming that this is a sound method of evaluating running backs relative to their teammates, we can then extend our comparisons to players from other teams (we’re really just creating a baseline for efficiency comparisons similar to how Dominator Rating and other market share-based metrics create baselines for volume-based comparisons).
The key metrics I use to evaluate running back performance vs. that of their teammates are called Yards Per Carry+, Chunk Rate+, and a metric I developed recently called Box-Adjusted Efficiency Rating, or BAE. I also like to use a metric called Breakaway Conversion Rate, but that is not a teammate-relative measure and we’ll therefore look into it separately.
The metrics are pretty straightforward: YPC+ is the degree to which a player over- or under-performs his teammates in yards per carry, and Chunk Rate+ is the degree to which a player over- or under-performs his teammates in rate of “chunk” runs (which I classify as runs of 10 yards or more). At a basic level, I want my running back prospects to find a way to produce more per carry than the other backs on the team, and part of that puzzle is navigating the line of scrimmage and extending runs into the secondary at a higher rate than his backfield mates. YPC+ and Chunk Rate+ measure the degree to which a player does both of these things.
BAE also does those things, but it improves upon Yards Per Carry+ by using a weighted average of a player’s per carry efficiency on carries vs. various amounts of defenders in the box (using data from Sports Info Solutions), relative to the per carry efficiency of other running backs on his team vs. the same box counts. The resulting percentage indicates to what degree a runner over- or under-performed his teammates on his total rushing attempts, relative to how often he faced each box count. BAE is a more comprehensive metric than is YPC+, and I will defer to it accordingly, but YPC+ and Chunk Rate+ will still be used given that the sample of data I have for those metrics goes back a decade-plus (while I’m only able to generate BAE Ratings going back to the 2018 college football season).
THE METRICS
Former Florida Gator Dameon Pierce spent four years in Gainesville and never served as a true lead back — his career high carry total is the 106 he handled in 2020 — while competing for touches with a group of running back teammates who averaged a 4.04-star rating as high school recruits, making them an 89th-percentile collective among teammates of backs drafted since 2007.
While he didn’t pull away from those guys in terms of volume, Pierce was one of the more efficient backs on the team during his four seasons. He maintained a positive YPC+ mark every year, and his career total of 0.56 is in the 52nd-percentile. In the same ballpark is his career Chunk Rate+ of 0.93-percent, a 48th-percentile mark. He actually failed to break off 10-yard runs at a greater clip than his teammates in his first three seasons before posting an 8.08-percent CR+ in 2021, a number that would match Jonathan Taylor‘s career mark and land in the 96th-percentile.
In the open field, Pierce was below average, converting just 25.3-percent of his 10-yard chunk runs into breakaways of at least 20 yards, a 27th-percentile performance.
Accounting for the amount of defenders in the box that Pierce faced paints a fairly similar picture as do his raw efficiency numbers. The box counts he saw were 0.12 defenders heavier than those his teammates ran against (a 63rd-percentile discrepancy), while his per carry output relative to those box counts gives him a BAE Rating of 114.4-percent, a number in the 43rd-percentile.
RUSHING EFFICIENCY SCORE AND COMPS
According to my infallible running back model’s composite Rushing Efficiency Score (which accounts for all the non-BAE metrics covered here, as well as overall team quality, opponent strength, rushing volume, and offensive line play), Pierce earns a 50.5 out of 100. Coincidentally, he earns the exact same mark in a BAE-centric composite score that I’m currently workshopping. The numbers all point to Pierce being a completely average runner of the football relative to running backs drafted in the last decade-and-a-half.
Based on the same metrics that go into the Rushing Efficiency composite in addition to physical attributes like height, weight, and athletic testing numbers, Pierce’s most similar players from a “pure runner” perspective according to my model’s comp machine are the following:
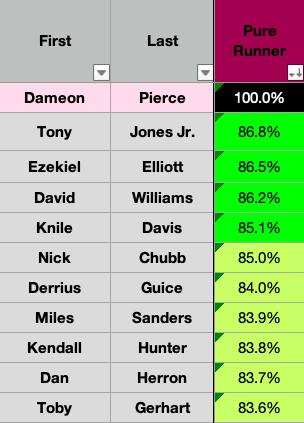
At 5-9 and 220-pounds (I’m also assuming he runs a 4.50 forty for the sake of generating similarity scores), Dameon Pierce is a rocked up back built similarly to Ezekiel Elliott, Nick Chubb, and Derrius Guice, but I’m still shocked at the sex appeal of these comps. Like those guys, Pierce played with very talented backfield teammates at blue blood college football programs. The difference between his profile and theirs is that: a) they were productive (read: earned touch volume) at those powerhouse schools, and b) his rushing efficiency resumé matches theirs in the same way that Don’t Look Up is similar to Dr. Strangelove. Both are apocalyptic dark comedies, but one of them does what it sets out to do much better than the other. Pierce is similar in style and shape to these other backs, but he’s not similar in quality. Here are their rushing efficiency profiles side-by-side, sorted by Rushing Efficiency Score:
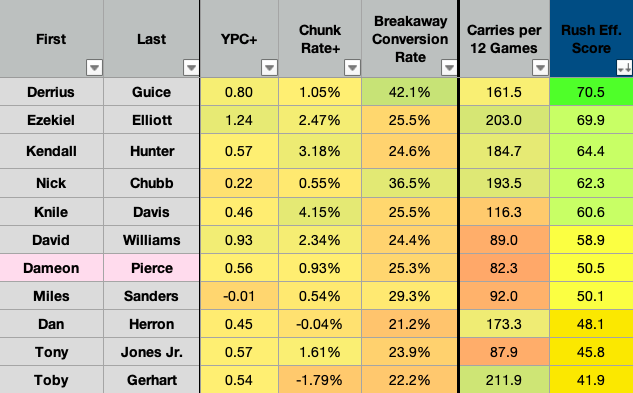
LAST WORD
Dameon Pierce is an interesting prospect in that he’s very solidly built, was a fine runner at a big-time school, and is supposedly athletic, but he’s simply closer to Tony Jones or David Williams than he is to Ezekiel Elliott (and for the Miles Sanders zealots still clinging to a prospect profile propped up by baggy sleeves and a tinted visor, so is he). He’s essentially a broke man’s Derrius Guice, and while I don’t think he’s a bad player, I do think he’s just a guy at the next level.