This article is part of a series in which I evaluate 2022 rookie running backs solely on their ability to run the ball. The first installments can be found here. If you happened to already catch those and don’t need a refresher on my methodology, feel free to skip to the player-focused analysis below the picture of Oklahoma’s Kennedy Brooks a couple paragraphs down.
Outside the ability of whoever happens to be running the ball, there is a whole mess of variables that factor into the effectiveness of a given rushing attack: scheme, play-calling tendencies, opponent strength and scheme, weather, offensive line play, surrounding skill-position talent, etc. And given this entanglement, separating the contributions of the ball carrier from the offensive environment in which he operates is not a straightforward task. My approach to doing that is centered around measuring the degree to which a running back is over- or under-performing the per-carry output of the other running backs on his team.
Starting from the premise that good runners do more with what they are given than do bad runners, it stands to reason that, provided players are operating under generally the same conditions (like, for example, playing on the same team), better backs should produce more per carry than lesser backs. Using this logic, we can establish a baseline for comparing efficiency between players on the same team; for each running back, we can compare his performance (X) to the collective performance of every other running back on the team (Y). If X > Y (essentially, if dude is doing more with his carries than his teammates are with theirs), we can probably conclude that the player in question is a good player, at least to some relative degree.
Assuming that this is a sound method of evaluating running backs relative to their teammates, we can then extend our comparisons to players from other teams (we’re really just creating a baseline for efficiency comparisons similar to how Dominator Rating and other market share-based metrics create baselines for volume-based comparisons).
The key metrics I use to evaluate running back performance vs. that of their teammates are called Yards Per Carry+, Chunk Rate+, and a metric I developed recently called Box-Adjusted Efficiency Rating, or BAE. I also like to use a metric called Breakaway Conversion Rate, but that is not a teammate-relative measure and we’ll therefore look into it separately.
The metrics are pretty straightforward: YPC+ is the degree to which a player over- or under-performs his teammates in yards per carry, and Chunk Rate+ is the degree to which a player over- or under-performs his teammates in rate of “chunk” runs (which I classify as runs of 10 yards or more). At a basic level, I want my running back prospects to find a way to produce more per carry than the other backs on the team, and part of that puzzle is navigating the line of scrimmage and extending runs into the secondary at a higher rate than his backfield mates. YPC+ and Chunk Rate+ measure the degree to which a player does both of these things.
BAE also does those things, but it improves upon Yards Per Carry+ by using a weighted average of a player’s per carry efficiency on carries vs. various amounts of defenders in the box (using data from Sports Info Solutions), relative to the per carry efficiency of other running backs on his team vs. the same box counts. The resulting percentage indicates to what degree a runner over- or under-performed his teammates on his total rushing attempts, relative to how often he faced each box count. BAE is a more comprehensive metric than is YPC+, and I will defer to it accordingly, but YPC+ and Chunk Rate+ will still be used given that the sample of data I have for those metrics goes back a decade-plus (while I’m only able to generate BAE Ratings going back to the 2018 college football season).
THE METRICS
Oklahoma’s Kennedy Brooks has been down in Norman since 2017. But he actually only played three seasons. He was redshirted as a true freshman and then opted out during the big COVID season in 2020. In the three years he did suit up, he carried the ball 472 times while playing with a group of running backs that averaged a collective 3.71-star rating as high school recruits. This makes them a 69th-percentile backfield among teammates of running backs drafted since 2007. Brooks averaged almost a full yard per carry more than those guys did over his career. His 0.96 YPC+ is also a 69th-percentile number. Similarly, the rate at which he produced 10-yard runs relative to his teammates was good for a 65th-percentile 2.40-percent Chunk Rate. Against a very talented backfield group, he performed at a level that two-thirds of running back prospects going back a decade-and-a-half have not matched.
Brooks did have a slightly easier path to his production than his teammates did, as the box counts that he saw were 0.06 defenders lighter, on average, than theirs were, a discrepancy in the 34th-percentile. However, even accounting for those light box counts produces a BAE Rating for Brooks of 116.5-percent, basically exactly average and landing in the 49th-percentile.
In the open field, Brooks was excellent, as he turned his 10-yard chunk gains into breakaways of at least 20 yards at a 38.1-percent clip, an 81st-percentile conversation rate.
RUSHING EFFICIENCY SCORE AND COMPS
I’ve been using two different composite rushing numbers to grade out the profiles of these prospects, one that is centered around the box count-adjusted metrics, and one that doesn’t use them at all. In the first, Brooks rates out at a 63.8 out of 100, the fifth-highest mark in the 2022 class. In the second — my model’s Rushing Efficiency Score and a composite that accounts for all the non-BAE metrics in this article in addition to overall team quality, offensive line play, rushing volume, and strength of opponent — Brooks scores a 69.2 out of 100, good for fourth in the class.
Using the same metrics that contribute to the Rushing Efficiency composite while also accounting for physical measurables — we’ll assume that Brooks runs a 4.50 in the forty at 215-pounds and just under 5-11 — my model also generates similarity scores between prospects. The following are Brooks’ closest comparables in the “pure runner” category:
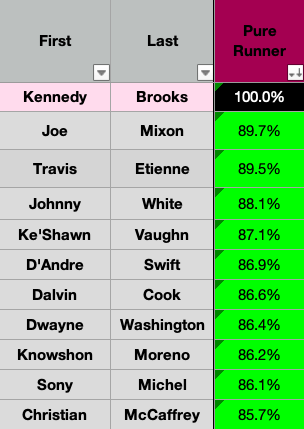
I mean, c’mon. There’s at least fives dudes on this list that we should be hyped about comping to an incoming prospect. And I’m a fan of Travis Etienne and Sony Michel as well, so make it seven. These aren’t weak comps either. I just spent 10 minutes looking through all the rushing efficiency articles I’ve put out so far. No other running back in this class has gone 10 deep with at least 85-percent matches (Abram Smith is closest, at 9). Brooks actually goes 15 deep. The next five on the list are Derrius Guice, Jeremy McNichols, Ronald Jones, Chuba Hubbard, and Alvin Kamara.
LAST WORD
I don’t know what I’m missing with this guy. He wasn’t super productive and he wasn’t very involved in the passing game. But a) we’re hyping ourselves up over other Power 5 committee-back prospects like James Cook and Dameon Pierce, b) Kenneth Walker caught even fewer balls and he’s a consensus top-3 runner in the class, and c) based on his frame and team-relative efficiency profile at a top-tier program, why can’t Brooks be a high-volume two-down runner in the same mold as someone like Michel or Damien Harris? I have no idea how athletic he’s gonna be at the Combine. But he’s getting zero hype, so who gives a shit. He’ll likely cost nothing in your rookie draft. And the numbers suggest he’s as good a pure runner as nearly anyone in the class.