
In my data-centric evaluations of college running back prospects, I start from the philosophical premise that good runners do more with what they are given than do bad runners. And therefore, provided players are operating under generally the same conditions as each other, a better back will produce more efficiently than a lesser back. That path of logic led me to (at least in part) evaluating players by measuring the degree to which they over- or under-perform the output of other runners on their teams on a per-carry basis.
The “raw” metrics I’ve used to do these evaluations are yards per carry and 10-yard run rate. I call the resulting team-relative versions Yards Per Carry+ and Chunk Rate+. Positive marks in YPC+ and CR+ indicate that a player is outperforming the other running backs on his team. Negative marks indicate that those other backs are performing more efficiently than the player in question. This method provides context to raw efficiency numbers, giving us a baseline from which to compare players between teams. In other words, it’s not necessarily more impressive for running back A to average 5.6 yards per carry on Team X while running back B averages 5.4 yards per carry on Team Z. But if we know that RB-A averages 1.3 yards per carry more than his teammates do and RB-B averages 0.8 yards per carry more than his teammates do, we can be a bit more confident in our conclusions about RB-A doing the better job.
This type of analysis gives more context to running back performance, but it’s not perfect. One thing it doesn’t account for is the different situations that different backs are faced with within an offense. RB-A might be averaging 1.3 yards per carry more than the other guys on Team X,. But if he’s running exclusively against light fronts on passing downs, is he really doing something greater than what RB-B is doing if RB-B is the bellcow for Team Z’s anemic offense, outdoing the efficiency of his backups while pounding into defenses that are expecting the run play after play? Previously I had been accounting for this absent context by giving players credit for the volume they handled, basically under the assumption that higher-volume backs experience more fatigue and see defenses that are geared up for the run more often. So we should modify our expectations (and evaluations) of their performance accordingly.
Overall, this sort of analysis has served me well. My running back model is both intuitive (for the most part, it agrees with conventional wisdom about which players are good and which are not, and it’s often prescient when it differs) and useful (it’s better at projecting NFL production than draft capital is). But the Isaiah Spiller discourse has inspired me to make a change.
A couple weeks ago, I wrote an article to share my findings on the Texas A&M product’s performance in the efficiency metrics I like to use, which was, frankly, bad (Spiller’s performance, not my article, the article is great). His YPC+ mark is in the 12th-percentile among backs drafted since 2007, and his CR+ mark is in the 15th-percentile among the same group. Upon publishing this article, the film grinders and the Spiller stans came out of the woodworks with all sorts of objections, some valid and some not. One of the more legitimate points I saw on Twitter came from campus2canton.com‘s Chris Moxley, who posited that the difference in usage between Spiller and the more efficient A&M running backs (or Devon Achane specifically) is so great that an efficiency comparison between Spiller and his teammates might not be conducive to a fair or worthwhile evaluation of Spiller’s ability.
I set out to investigate this theory (using data from Sports Info Solutions) and found that there was almost no difference in the rate at which Spiller and Achane carried the ball in the presence of a variety of variables: different offensive personnel groupings, with or without pre-snap motion, in or out of shotgun, quirks in down-and-distance (like carries on traditional passing downs or those in obvious run situations), from non-traditional means like end-arounds or jet sweeps, etc.. Interestingly, I found that Spiller and Achane both averaged exactly 6.4 defenders in the box per carry in 2021, and Achane actually saw a higher rate of boxes with 8 or more defenders than Spiller did.
This investigation solidified in my mind that a Spiller-Achane efficiency comparison is completely legitimate, but it also gave me the inspiration to develop a method for evaluating running back efficiency relative to their teammates in a way that better accounts for the situational context that is lacking in YPC+.
Introducing: Box-Adjusted Efficiency Rating
Because of research like this, this, and especially this and this, we know that the amount of defenders in the box pre-snap is a major determining factor in the success of any given rushing attempt. Due to this importance, accounting for box counts lends a massive contextual element to running back efficiency analysis using yards per carry. RB-A’s 5-yard run against a 6-man box on 3rd-and-11 is probably not a better indication of strong play than RB-B’s 4-yard run against an 8-man box on 4th-and-2.
I set out to account for this dynamic by comparing a given player’s yards per carry vs. a given box count to that player’s teammates’ yards per carry vs. that same box count, and then compiling the aggregate vs. all box counts using a weighted average. This analysis tells you how a running back did relative to other backs in his offense against each individual box count he faced, as well as how he did relative to other backs in his offense across all carries and all box counts, relative to how often he carried the ball against each box count. Once you find to what degree each player over- or under-performed their teammates, you can use 100-percent as your universal baseline (meaning a runner performed at 100-percent of the level his teammates performed at, “average” for whatever particular offense a player operates in) to then compare players between different teams. A guy who performed at 98-percent of his teammates’ box count relative-efficiency probably did not accomplish a greater feat than another guy who performed at 112-percent of his teammates’. That percentage is what I’ve decided to call a player’s Box-Adjusted Efficiency Rating, or BAE.
An illustration of Isaiah Spiller‘s career BAE is below, with a breakdown of his performance vs. each box count relative to that of his backfield teammates, and the aggregate score highlighted in green:
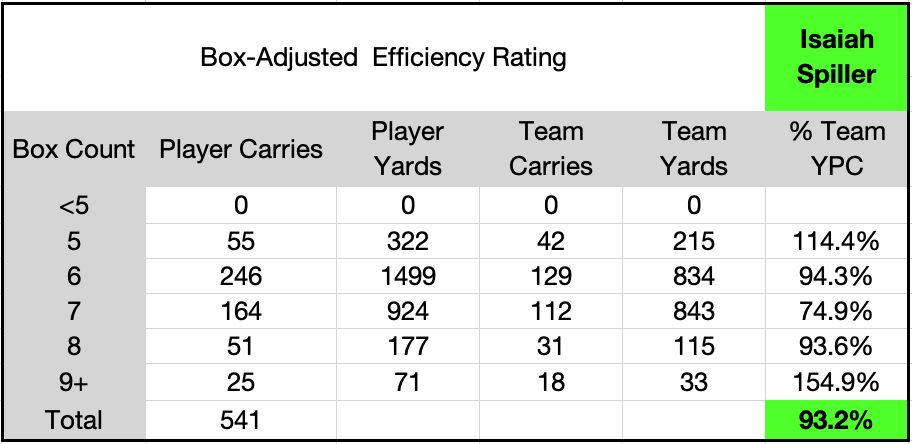
Basically what this means is that on his 164 carries against 7-man boxes, Spiller gained 924 yards (5.63 per carry), while other backs on the team gained 843 yards on 112 carries against 7-man boxes (7.53 ypc), thus Spiller gained 74.9-percent of the average team carry against 7-man boxes on his runs against 7-man boxes (5.63 divided by 7.53, with some rounding). The weighted average of that math for each box count is Spiller’s BAE Rating of 93.2-percent.
So, as it pertains to Spiller, his usage was so different from that of Devon Achane and the rest of the Aggie backs that not only did he average 0.73 yards per carry less than his teammates over his 541 career carries, he did so while facing lighter box counts on average and producing just over 93-percent of the per-carry output of the rest of the team against those box counts. Seems not good, and I was able to confirm as much after calculating BAE Ratings for 19 other backs in this rookie class.
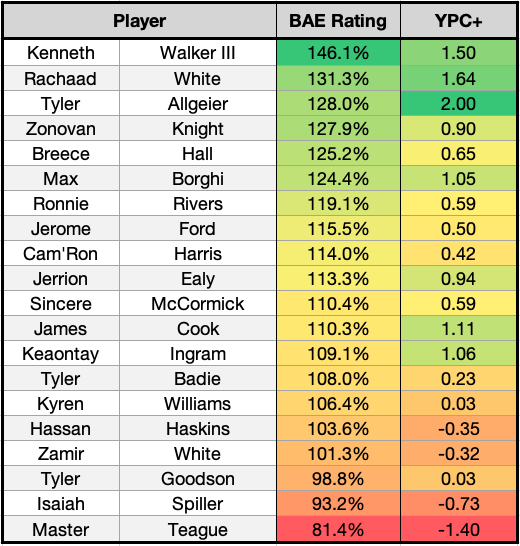
My initial takeaway here is that the conclusions gleaned from YPC+ are really not far off from those offered by BAE Rating. In this very limited sample, YPC+’s correlation to BAE Rating has an r-squared value of 0.75, which is relatively high. BAE offers more context and is more intuitive, but in lieu of the advanced data needed for BAE being available, you can likely feel around in the dark with YPC+ and come to similar conclusions.
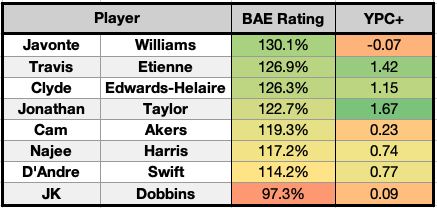
Going forward, I will be using BAE to get a more complete, contextualized idea of how running back prospects are performing relative to their teammates, as well as using average box count data to inform my usage of Chunk Rate+ in evaluations. This box count data only goes back to 2018, so the population of players I’m reasonably able to generate “career” BAE Ratings for includes the running back classes of 2022, 2021, and 2020. Below are the BAE Ratings and YPC+ marks for some of the most prominent backs from the ’21 and ’20 classes:
TEAMMATE TALENT LEVEL
From here I see two steps: the first is accounting for the talent-level of the teammates that we are comparing a player to. BAE Rating (and YPC+) tells us what a player did relative to their teammates, but it doesn’t tell us how impressive that feat was vis a vis how good those teammates were. I anticipate continuing to use recruiting star ratings as an imperfect but fair (because it doesn’t have the benefit of hindsight) quantification of that talent-level. Accounting for that dynamic would indicate that James Cook‘s 110.3-percent BAE Rating is probably “better” than Sincere McCormick‘s 110.4-percent BAE Rating, considering that Cook’s efficiency is being compared to teammates who came out of high school rated 4.10 stars on average while McCormick’s teammates earned an average of only 2.60 stars.
SCHEME
The second step is accounting for scheme. BAE Rating tells us what a player did against all box counts relative to his teammates, but it does not tell us how he performed on different kinds of runs relative to them. We might (and I mean “might” earnestly, I truly don’t know) expect a different result against a 6-man box when we run stretch vs. inside zone. I could run the same sort of analysis here as I did with box counts to gain insight into how good a running back is while carrying the ball in various running schemes.
I actually did that with Isaiah Spiller and the rest of his A&M teammates for the 2021 season. On the five different run types on which Spiller and other Aggie backs each had at least 10 carries, here’s what I found:
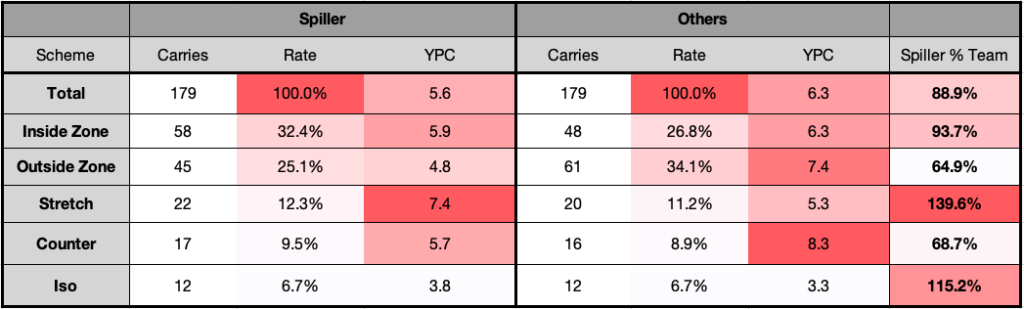
The most common run type for Spiller was inside zone, where he produced at 93.7-percent the per carry rate as the rest of the team. His second most common run type was outside zone, where he produced at only 64.9-percent of the rest of the team’s per carry output. Inside and outside zone combined to make up nearly 60-percent of Spiller’s total carries, but he did outdo other Aggie runners on a combined 19-percent of his total runs on stretch and iso carries. He lagged significantly behind his teammates on counter runs.
My conclusions here are basically that on Texas A&M’s bread-and-butter run plays (which were pretty similar for Spiller compared to the rest of the team, with inside and outside zone preferences flip-flopped for the two), Achane and the other guys were simply doing more with their opportunities than Spiller was doing with his (and against essentially the same box counts, as we saw above). Further analysis here could combine BAE with Scheme-Adjusted Efficiency Rating (SAE? meh.). But given that box count is really the tail that wags the dog of rushing efficiency, I don’t expect the fruits to outweigh the labor of going through all the scheme-related data.
LAST WORD
In conclusion, shoutout to Moxley and the Twitter vigilantes for bullying me into improving my process. I’m still out on Isaiah Spiller , and you can expect to see BAE Ratings as a big part of my running back evaluations going forward, with YPC+ and Chunk Rate+ hanging around as decent proxies with larger data sets going back a decade-plus.